This second release of All Media and Products Survey (AMPS) shows a media playing field where the players are tenaciously holding onto their patch of turf, according to SAARF.
Overall, the results for AMPS 2008B are little changed over the previous survey. Few media have managed to grow their audiences, but on the upside, few have lost audience.
All comparisons made are between the previous AMPS release, AMPS 2008A (covering the July 2007 to June 2008 fieldwork period), and the current release, AMPS 2008A (covering the mid-January to mid-December 2008 fieldwork period), unless otherwise stated.
Over the past decade, the makeup of the South African population has changed substantially. In 1999, there were 1.1 million more females than males. Today, there are only 106 000 more. The impact of HIV/AIDS is apparent with younger females. There are now proportionately more males than females in the two younger age groups. In 1999, there were 178 000 more females than males aged 16-24, and currently, there are 170 000 more males.
Similarly, in the 25 - 34 age group, there are now 325 000 more males than females, where 10 years ago women outnumbered men by 139 000. The difference between males and females in the 35+ groups is less disparate.
Service levels in South Africa have not improved over AMPS 2008A, with access to electricity and water remaining unchanged at 88.6% and 77.1% respectively. As with services, the number of appliances and electronic goods in homes has stayed relatively stable.
The only shifts were in high-tech appliances, such as home PCs, home theatre systems and M-Net/DStv decoders. Cellphone growth has slowed, with access to cellphones stable on AMPS 2008A (at 67.9%). Home phones, however, have continued their downward march, dropping from 19.4% in the previous survey, to 18.2%, particularly in metros, cities, large towns, and in Gauteng.
The lower LSMs declined significantly in the previous two AMPS releases, but movement has now stopped. Similarly, the growth seen in LSM 4-6 has abated. The current LSM picture remains largely unchanged over AMPS 2008A.
Local employment levels have remained unchanged over the previous AMPS release, with the impact of the global economic recession yet to be picked up by the survey.
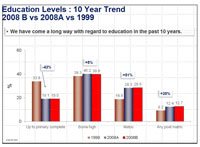
Proportionately, there are more people working now than five years ago, as measured by AMPS 2003, but looking back to 1999, levels are sorely down. It is of great concern that even those with a higher education are unemployed. Just having a matric is no longer good enough. Eight percent of people with a tertiary qualification are unemployed and seeking work, while 30.3% of people holding a matric qualification are without work. Average monthly income is up slightly over AMPS 2008A, from R6 537 to R6 771.
Education
Education levels have remained unchanged over AMPS 2008A.
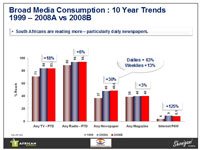
The print medium has held its own since the previous AMPS survey, with no significant growth or decline. Print reaches 60.3% of SA adults, with a total readership of 18 870 million people.
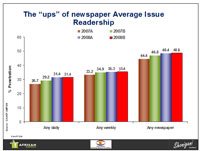
In total, newspapers reach 48.6% of all adults, with 15 222 million readers. There has been no movement over AMPS 2008A.
| Newspaper snippets: |
|---|
Stable - Any Daily Newspaper: readership of the dailies has remained precisely as it was in the previous AMPS, at 31.4%. There are 9 844 million daily newspaper readers.
Stable - Any Weekly Newspaper: as with the dailies, there is no change over AMPS 2008A. Weeklies reach 35.4% of all adults, with 11 068 million readers.
The top-five daily newspapers are:
The top-five bi-weekly/weekly newspapers are:
The only changes in the newspaper sector have been the following demographic shifts:
How newspaper readership varies by LSM, comparing AMPS® 2008A with AMPS 2008B.
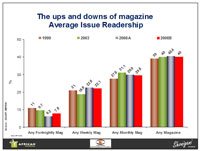
Magazines
As in AMPS 2008A, magazines in total have remained stable, with no significant growth or decline being reflected in the latest AMPS release. Magazines reach 40% of South African adults, with 12 537 million readers.
The top-five magazines are:
The only other statistically significant changes in the magazine sector were to the readership profiles of the following titles:
(Please note that SAARF TAMS is the official currency for television.)
Seven-day total TV viewing is stable over the previous period as well as the year previous: 83.7% of South African adults watch television across a week. As in the previous AMPS release, DStv is the only channel to have achieved significant growth. The satellite offering now reaches 16.8% of adults, up from 15.2% in AMPS 2008A. The growth of DStv's audience comes from both males and females, and especially the 16 - 24 age group. Areas which have driven the platform's growth are Gauteng (and particularly Greater Johannesburg and Pretoria), Durban and Pietermaritzburg, across metros, cities and large towns.
Performance across the week for SA's other TV channels is as follows:(Please note that SAARF RAMS is the official currency for radio.)
Levels of cinema attendance have remained stable over AMPS 2008A. The only changes in the medium have been demographic in nature: attendance is down in metros for the three- and five-month filters, and is up in Pretoria for the “Cinema - Ever” filter.
As with other media, Internet usage is stable over the previous survey. There were also shifts in the profile of Internet users.
(The electronic measure, SAARF OHMS, is the official currency for out-of-home media.)
There were no significant gains or losses in audience for the various out-of-home media. A number of media types, however, had profile shifts over AMPS 2008A.
| Reach | Gains in | Losses in | |
|---|---|---|---|
| Billboards | 72.3% | None | None |
| Stores | 79.7% | Pretoria | Reef |
| Taxi ads | 64.8% | Bloemfontein | Reef |
| Truck ads | 64.00% | Durban, Greater Johannesburg and Pretoria | None |
| Bus shelters | 39.1% | Bloemfontein | None |
| Buses | 41.4% | East London, Bloemfontein and Greater Johannesburg | None |
| Dustbins | 42.4% | Metros, the Free State, Durban, Pietermaritzburg and Bloemfontein | None |
| Trailer ads | 40.9% | None | None |
| Trains | 12.3% | None | Reef |
• SAARF AMPS provides a wealth of information on South Africa's adults (aged 16+, and aged 15+ from AMPS 2009A). The cornerstones of AMPS are people's demographic data, which media they consume, from print to radio to cinema, and which products and brands they purchase and use. AMPS also includes branded information, with data on products and brands, including FMCG brands, fast food outlets, cell phones, financial institutions, and food and grocery retailers, amongst others. This allows users to match target markets with media consumption behaviour, segment markets, identify characteristics of media consumers as well as their brand usage, and identify opportunities for individual media types and titles.