From 2005 to 2007 inclusive (2008 figures not yet available), the largest and second most expensive option at DHMS (Classic Comprehensive - 446,860 out of total beneficiaries of 1,914,784 at December 31, 2007 - 23%) has not been commercially viable. The table below shows that in 2005 the claims ratio (the % of the net premium that is used for medical care) shot up to 95%. Although the ratio improved, going down to 91% by the end of 2007, it was still far too high, particularly at a scheme where non-healthcare costs are 20% of net premium income.
Information in table extracted from scheme financial statements for 2005 to 2007, regulatory reports for 2002 to 2003 and both for 2004 - Stanley L. Eiser, January 2009.
The severity of the rupture in Classic Comprehensive, and how far out of line its performance is with the rest of the sizeable options in the scheme, is demonstrated by the size of the differential between it's claims ratio of 91% in 2007 with the claims ratios of the three next biggest options in the scheme: Coastal Saver 67%, Classic Saver 61% and Essential Saver 62%.
It is not just the high claims ratio of Classic Comprehensive that has led to the lower benefit options carrying Classic Comprehensive (and the Executive Option), it is the very low claims ratios in the lower benefit options that highlight their cross subsidization of the richer options.
The scheme has been able to absorb Classic Comprehensive's losses largely because of the low claims ratios in the lower benefit options. This is the antithesis of affordable healthcare. If anything subsidization should be the other way around. What has happened at DHMS is in direct contradiction with what the country is striving to achieve. It is also a slap in the face for the largely poorer members of the lower benefit options at the scheme and for poorer people in general. The surplus created by the lower claims ratios in the lower benefit options could and should have been used for the benefit of the beneficiaries of those options, who need it the most, and not to help lessen the impact on the scheme of premiums that are undeniably too low for the richer members of the scheme in Classic Comprehensive (and the Executive Option).
Members of the lower options would be outraged to learn of what has happened. It brings into question the competence of the administrator and should question the moral conscience of the trustees of the scheme, who are directly responsible to the members.
The trustees rely exclusively on Discovery Health for guidance, leadership, management and business services. However, they have not even been critical of the administrator's performance. Instead, based on their reviews of the scheme's performance in the 2005, 2006 and 2007 scheme annual reports, the trustees are highly complimentary of the administrator and feel that members are getting good value from it. Discovery Health has gone to great lengths to defend the extremely high fees it charges DHMS. However, the poor management of Classic Comprehensive and, as a result, the sorry state of imbalance it has left the scheme in at the end of 2007 should finally put this matter to bed. What was once among the scheme's strongest options became its weakest, relying on smaller options with poorer members to support it.
Information in table extracted from scheme financial statements for 2005 to 2007- Stanley L. Eiser, January 2009.

Information in table extracted from scheme financial statements for 2005 to 2007- Stanley L. Eiser, January 2009.
The scheme's 2008 annual report which normally comes out in the 2nd quarter is eagerly awaited. However, before this it will be interesting to hear what Adrian Gore, the CEO of Discovery Holdings, the administrator, has to say about the scheme's performance in the Discovery Holdings interim results presentation scheduled for February 19. I anticipate that he will report that the scheme has met its target of reaching minimum solvency, though don't expect him to get into which options got the scheme there.
If the scheme has reached minimum solvency, this is not something he should be proud of. It is an indictment of both the scheme's trustees and the poor performance of the administrator that a scheme as large as DHMS has been below this threshold for so long. Discovery Health has publicly maintained that growth in membership has caused pressure on reserves and has prevented the scheme reaching minimum solvency. The claims ratios table above and the table below on the Net Healthcare Result show clearly that the biggest recent impediment to building solvency margin at the scheme has been Classic Comprehensive, which had no growth in membership in the period 2005 to 2007.
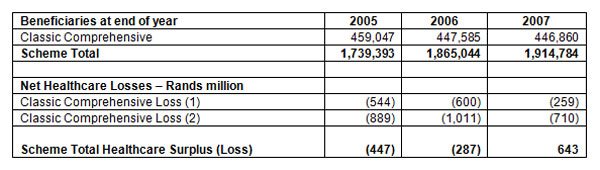
The table below shows the extent of Classic Comprehensive's negative impact on the net healthcare result of the scheme from 2005 to 2007:
Net Healthcare Surplus (Losses):