


We also forget that weather affects a lot more than just agriculture. Weather patterns and events affect many industries and people's daily jobs or tasks including construction, sport, mining, aviation, tourism, energy demand or usage, infrastructure maintenance, and municipal services. It also increases traffic congestion and the resultant loss of productivity.
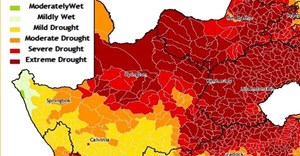
The drought has an impact that everyone feels through the price of bread and maize meal - it keeps going up. Not to mention fruit and veg. As we saw from the 1-in-75-year drought last year, the weather is one of the largest risks facing producers as it's what determines what will either be a good, bad or indifferent season. Added pressure comes from rand volatility, the cost of imports and government capacity to regulate the sector to the benefit all role players whilst ensuring food security.
Back to the armyworm. Originally from South America, it has popped up this season with outbreaks initially in Northern Limpopo and North West, having marched and flown south from Nigeria, Tanzania, Malawi, Zambia, and Zimbabwe. Our very own insect migrants along with locusts, and Quelea birds.
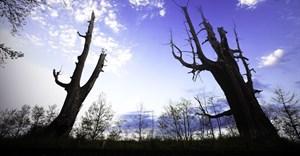
According to Johnnie van den Berg, an entomologist at South Africa's North-West University, some farmers have lost 90% of their crop with maize reduced to fields of stalks. Industry sources have said while an armyworm outbreak would be unlikely to push the crop into deficit it could reduce the size of the expected surplus.
The ability to monitor this used to be provided by the Agricultural Research Council Plant Protection unit but the funding was cut in 2007. It seems that nobody is really capturing the data or tracking the phenomenon. It would be in the interest of all parties linked to the agricultural value chain to recreate this capacity to enable a timely and efficient response to known outbreaks as well as forecast swarm movement through wind patterns, moisture, and temperature. The same applies to the Red Quelea bird and locust formation, swarms of which destroy hundreds of millions of rands worth of crop every year in South Africa, despite great expense in pest eradication, all with significant environmental damage or trade-offs.
To understand more about the El Niño phenomenon, what follows is an extract from an expert on ENSO that provides an excellent review of where we're at. You can find more information about South African weather and its impact on agriculture at ZONESCAN, one of the data platforms developed by eEvolution.
The January 2017 ENSO Update indicates that the La Niña is on her way out, and neutral conditions are expected to take over by next month. While she’s still hanging around let's take a tour around the world in 80 lines (or so).
The engine of ENSO (El Niño/Souther Oscillation, the whole El Niño and La Niña cycle) is the temperature of the ocean surface in the equatorial central and eastern Pacific. Since late summer 2016, the Niño 3.4 region has been cooler than the long-term average. December was -0.72°C below average, a slight uptick relative to the month before.
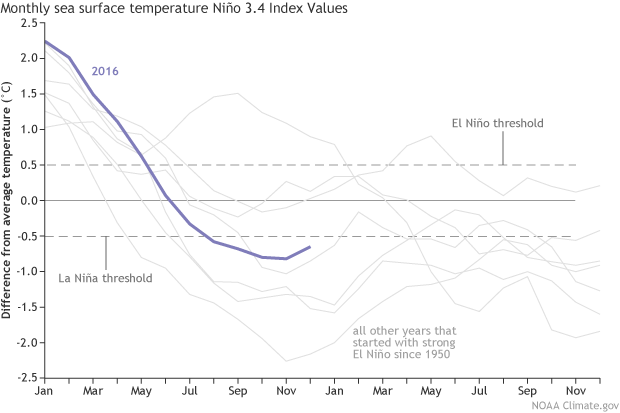
We assess ENSO on seasonal timescales, meaning the average over several months. The average for the October – December period was -0.8°C, so we now have four successive three month periods with an average cooler than the La Niña threshold of -0.5°C. Five successive seasons are required to officially qualify as a La Niña event. Forecasters are confident that the November – January period will qualify as continuing the La Niña, but predict that the next period, December – February, will be warmer, and likely end up in neutral territory (between -0.5°C and +0.5°C).
Nearly all of our computer models forecast this upward trend in the sea surface temperatures, giving confidence to the prediction that our weak La Niña is nearing its end. The store of cooler-than-average water below the surface has dissipated, too.
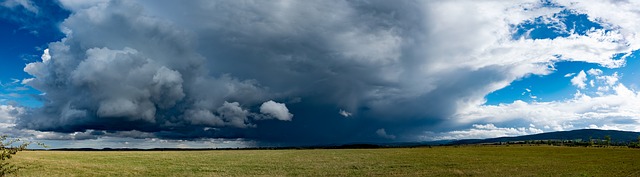
In December, there were still consistent signs of a weak atmospheric response to the cooler equatorial ocean, with reduced cloudiness and rain over the tropical central Pacific, and more over Indonesia. La Niña conditions mean the wind circulation in the tropical Pacific (east-to-west in the lower atmosphere, and west-to-east in the upper atmosphere) is stronger than average, an effect we also saw during December.
Taking a look at the global ocean map, you can see the small patch of cooler waters that is powering our La Niña is still embedded in a very warm (compared to average) Pacific Ocean. To the north, you can see a horseshoe pattern that resembles the positive phase of the Pacific Decadal Oscillation (PDO). Because ENSO can impact sea surface temperatures across the North Pacific Ocean, a positive (warm phase) PDO during La Niña is less common than a negative (cold phase) PDO during La Niña (though, during August-October 2016, the PDO was slightly negative.

Has this La Niña affected global weather and climate over the past few months? It’s very tough to point to any one weather or climate event and say “that was due to La Niña!” There are a lot of different, complex things going on in the atmosphere at any one time, interacting and affecting each other. It’s like trying to identify exactly which sneeze is due to the head cold you have, or to a random bit of dust floating through the air.
However, we can look at overall patterns and get a lot of information. If you’re sneezing a lot more than average, that pattern is probably due to the head cold. Likewise, we have expected outcomes during El Niño and La Niña and we can look at the global maps to see how much the observed patterns resembled the expected.
While the peak season of global ENSO impacts in the US is the Northern Hemisphere winter, the late fall has some expected precipitation and temperature impacts, too. (You’ll need to mentally swap the colors on the maps at those links, as they show the expected relationships for El Niño. The La Niña relationships are mainly the opposite.)
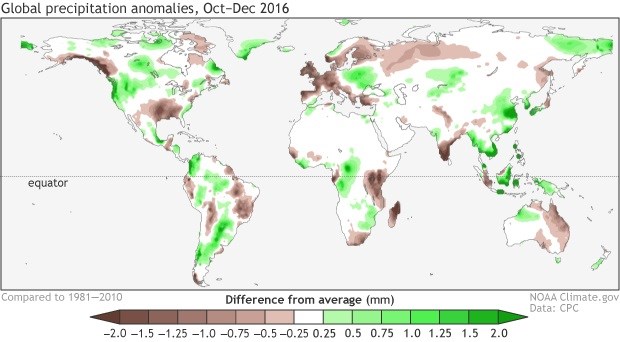
This past October – December’s precipitation over North America looked quite a lot like the expected La Niña effect: drier over Alaska’s southern coast and panhandle, wet in the Pacific Northwest, and drier than average across much of the Southeast.
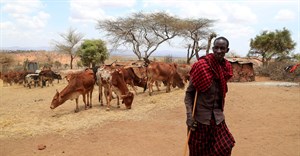
One fairly reliable La Niña impact is dry conditions through Uganda, Kenya, Tanzania, Malawi, Mozambique, and Madagascar, and this region was, in fact, dry during October – December. I chatted with staff at the Climate Prediction Center’s Africa Desk, and they told me this rainfall deficit has resulted in degraded ground conditions across many areas of these countries.

Most maps of global temperatures are warmer than average these days, as temperatures trend upwards with global warming. Of course, it’s not warmer everywhere all the time, because of all that complexity I mentioned earlier. The October – December 2016 temperature map has a lot of warmer-than-average colors, with some colder areas over northern Asia.
ENSO relationships with temperature are not as strong as they are with precipitation, especially during the fall. Northern Asia can be warmer than average during La Niña- opposite of what was observed this past fall - but this is a weak relationship, easily overwhelmed by other climate variabilities. Another La Niña tendency is a continental pattern over North America of cooler northwest/warmer south. This showed up a bit, with the northwest being not actually cool, but somewhat less warmer-than-average.
You may have noticed that some of the long-range computer model forecasts appear to be wandering back up into El Niño territory for the second half of this year. We’re not placing a lot of confidence in these forecasts and are favoring ENSO-neutral (~50% chance during August-October 2017), but the remaining odds are not evenly split: we are tilting the odds toward El Niño (~35% chance) over La Niña (15% chance). Forecasts of ENSO made in the winter and early spring has historically not been very skillful (the spring predictability barrier). Also, there are no strong signs right now giving us a good picture of what the summer and fall will look like.
A three-year series of El Niño/La Niña/El Niño has only happened once since 1950, in 1963/1964/1965. This doesn’t make it impossible that El Niño could develop, but it means that we aren’t counting on it.
One thing you can count on is that we’ll be watching all the ENSO indicators, and keeping you posted on all things ENSO!