


In the last three articles, we covered the following:
We now turn to more practical matters, such as why it is profoundly more useful; case studies; and a short discussion of implications.
When talking about the MSc measurement process, we emphasised that the paired comparisons were of a ‘full factorial’ design. This means that every item is compared with every other item. So, if you have three items (A, B and C) then there are three comparison tasks: A vs B, A vs C and B vs C. The order of each is randomly flipped to cancel out order effects, so B vs A is the same as A vs B. If you have four items then there will be six measurement tasks: A vs B, A vs C, A vs D, B vs C, B vs D and C vs D.
In effect, we are collecting more information than required if we assume that a person makes decisions according to a logical framework. Consider the case of three items. If a person judges A to be better than B and B better than C – then, according to the assumption of logical consistency, A IS better than C and we should not need to do the A vs C task. However, because we insist on the full factorial tasks being done, we have a measure of how consistent a person is. In the case of three items, one inconsistent rating equals 100% inconsistent.

In the course of an Ad-Audit study, each respondent will be doing an absolute minimum of 10 (If there are four attributes and three different ad executions, they would be doing 53) paired comparisons, all randomly presented. The probability of guessing the correct answers to all paired comparisons and therefore being ‘fooled’ that the person has a logical decision framework is infinitesimally small.
We use this information to remove from the analysis those who are very inconsistent. We analyse them separately to try and learn if there are patterns that explain why. So far, we have found different levels of inconsistency in different categories and different types of people. There are exciting new learnings with every project we undertake.
In January and February 2017, we conducted two case studies in South Africa and eight in the UK with Fly Research, our co-developers of Ad-Audit.

Leigh Andrews 12 Jun 2015
One client commissioned four replications of the same study – each N=300 – but with different executions. The hypothesis was that each study would give the same importance for strategy and executions components, with the following results:
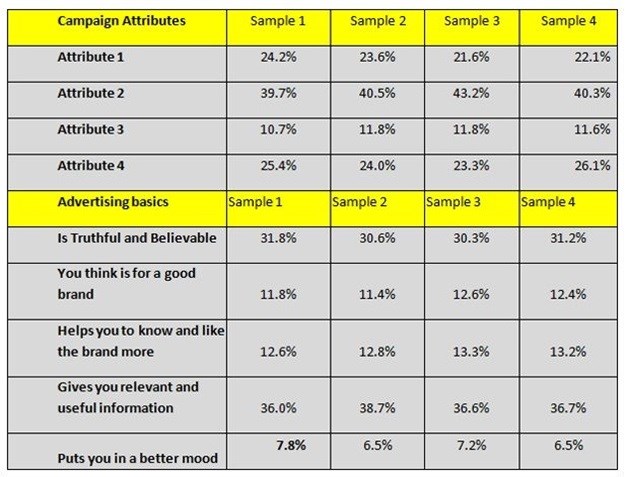
As is evident, there is very little variation across four studies in the same market over a period of two months.
Category-specific segmentation
In calculating additional insights into the advertising tests, Fly Research developed three metrics that are also category specific.

Confused % is the percentage of inconsistent respondents.
Signal to Noise ratio is the ratio of those who were consistent compared to those who were inconsistent – we treat this as the ratio of people who ‘get the message’ and decode it against those who were simply inconsistent and therefore unreliable. We hypothesise that the ratio will be higher in high involvement categories and low in categories like condiments.
Cut-through % is the percentage of people who were consistent but also completed the comparison tasks quickly of all people who were consistent – so they decoded the message quickly.
Cross tabbing these segments by the advertisements tested enables a clearer understanding of the effectiveness of the different executions.
In conclusion, Ad-Audit brings a wide range of objective metrics to help teams create more effective understanding. These new metrics do not necessarily replace any other existing metrics as they can be included in the same questionnaire. Pricing is competitive and delivery is fast as the methodology is applied on the TellUsAboutIt consumer panel of PSA. Surveys can also be redirected to client-owned panels. For more information, please contact me at PSA on 083 255 2668 or send an email to az.oc.ecneicsgnitekram@ekiM.