This follows industry sentiment regarding the relevance of LSMs, its misrepresentation of the South African landscape, its racist bias and other inaccuracies that it portrays. The new SEM household continuum, developed by Neil Higgs and his team at Kantar TNS, is not dependent solely on durables.
“SEMs speak as to how South Africans live and not what they have. This household continuum is a statistical and technical solution,” says Peter Storrar, Kantar TNS lead on the ES Survey conducted for the industry and funded by the Publisher Research Council (PRC) and the Broadcast Research Council (BRC).
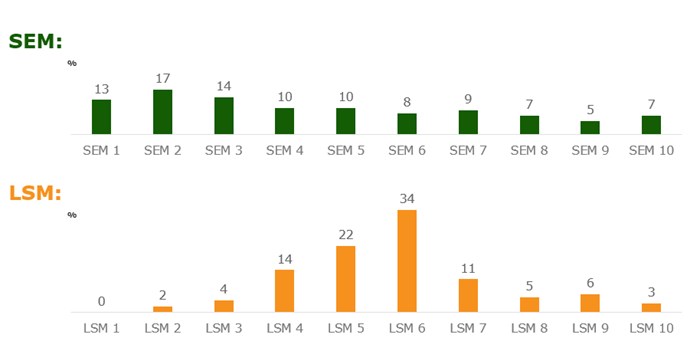
“The international measure of income distribution is the Gini coefficient and South Africa has one of the highest in the world, which means we have a very unequal income distribution with many haves and have-nots. As can be seen in the graph below it is obvious that the LSM, which has not been changed since 2011, is misrepresenting the South African household landscape.
Source ES: 6 months Jul-Dec 2016
“If only the LSM, an almost perfect bell shaped population distribution were true, we would have a massive middle class and an income distribution such as Canada or Australia has.
However, we do not, as we are still suffering the after effects of 350 years of colonialism, 50 years of Apartheid and 10 years of corruption, so our Gini coefficient is still high,” says Peter Langschmidt, consultant to the PRC.
The LSM shows that only 6% or 1 in 17 houses is in the bottom LSM 1-3 group, the SEM shows that 44% or 1 in 2.3 households are struggling. In terms of the important LSM 8-10 group, which receives over 70% of advertising spend, the SEM also outperforms the LSM with 19% of household’s vs 14% for the LSM.
In terms of practicality, the SEM also has numerous advantages over the LSMs. With 14 variables, versus the 29 on LSMs, questionnaires are shorter and easier to administer. SEMs are also more stable, due to less reliance on durables and more reliance on household structures and community infrastructure, which change more gradually.
The only four durables that have been included in the final variables are deep freezer, microwave oven, floor polisher or vacuum cleaner and washing machine. The others are post office nearby, police station nearby, built-in kitchen sink, home security service, motorcar, floor material, water source, type of toilet, roof material and number of sleeping rooms.
As promised, the LSM will be run in parallel with the SEM for a period of two years until 2018.
“If you or your clients believe in fairy-tale income distribution, which goes against all census and Stats SA data, then continue to use the LSMs but if you believe in an inequitable distribution and the 17 million social grants that people receive each month, then you must use SEMs,” concludes Langschmidt.
For more information, go to www.prc.za.com.